On Thursday night's post last week we looked at egg production. Tonight we'll look at rainfall. We have a rain gauge out on a fencepost by the water trough. Every day we check the gauge and record any rainfall on a paper log inside. Each month we tally up the totals and at the end of the year, record all data onto a spreadsheet. We've been tracking rainfall for about eight years now. There's no particular reason we do it - it is just interesting to us. I guess over years, it is good to look at trends. When are the driest months? When are the wettest months? Let's take a look:
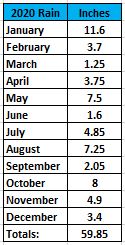
First off, you'll notice that we accumulated 59.85 inches of rainfall for the year, with the heaviest rainfall occurring in January and the lowest in March. As I look at the daily rainfall logs over 2020, I notice that in the entire year of 2020, it did not rain on the 9th, 16th, or 30th day of the month for the entire year! Furthermore, looking at last year's records, it did not rain at all on the 9th day of any month in 2019 either. What does that tell you? Nothing, really, except maybe in 2021, if you were planning an outdoor wedding or a picnic, or a fishing trip, the 9th might be a good day to plan it.
Now let's compare to the eight year accumulated data:
Over the 8 year data collection period, we've averaged almost 67 inches of rain each year or about 5 1/2 feet of rain each year. The wettest month on average over the 8 year trend is August; however, the wettest month in 2020 was January. The driest month on average over the 8 year trend is March. The driest month in 2020 was March as well. Over the eight year period, we've accumulated 44 1/5 feet of water. That's a lot of precipitation! At Our Maker's Acres Family Farm, we wish you and your family showers of blessing in 2021.


No comments:
Post a Comment